Information Cartography
L.John Old, Ph.D,
Edinburgh Napier University
Information CartographyL.John Old, Ph.D, Edinburgh Napier University |
|
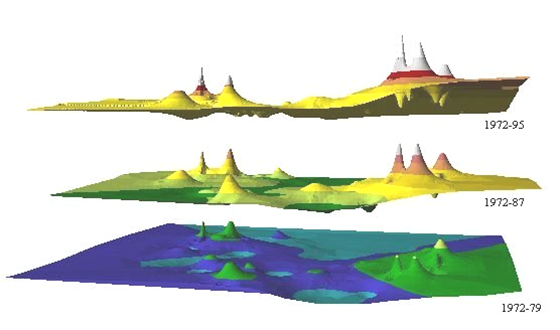
| Fig. Author citation over three periods |
Information cartography, as used here, means building maps of non-geographic information, usually using geographic software. More formally:
The process of building models (information maps) based on data that is not geocoded (that is, non-spatial, non-geographic data that has no real-world co-ordinates); and usually utilizing the extensive functions of Geographic Information System (GIS) software. It draws on the metaphor of an information landscape populated by information landmarks, which form an information map.
The concept of Information Cartography (IC) has evolved, elaborated and matured over time. It was not originally envisioned as a context-independent tool for visualizing and analyzing data, information and knowledge from different sources, as this brief History of Information Cartography illustrates.
Martins Dodge's website, An Atlas of Cyberspaces makes no claims about Information Cartography, but it is the richest source of examples of the creative use of the mapping metaphor anywhere. Many of the graphics are indeed, "information maps." The US Department of Energy's Pacific Northwest National Laboratory, PNNL, has likewise, some exceptional examples (See also the discussion on Cartia on the IC History page).
Theory
Powerful analyses can be made of data which has a "geographic hook." Location information (addresses, postal codes, phone number area codes, voting districts, and so on) provides a link between maps and data about patients for health demographics, buying habits and income levels of customers for identifying the best location for a new business, or the best place to advertise a product. The same principle applies to weather patterns, land usage (such as deforestation), voting results, and so on.
Data that has no geographic hook, on the other hand, cannot be connected to maps of real-world locations. Instead, information cartography (information-cartographic methods) takes such data and generates maps based on attributes taken or derived from the actual data. In other words, in order to be visualized, the information needs to be spatialized somehow--it needs to be transformed, and coordinates calculated that allow it to be placed sensibly, for the purposes at hand, on a surface, as a map. This is in contrast to representations (sometimes also called information maps), such as graphs, where the absolute location of a node is not significant (see for example), or other metaphoric landscapes such as "soundscapes"(McGregor, Crerar, Benyon, & Macaulay, 2002).
How
Information maps are based on a substrate or landscape. The landscape can be derived directly from objects or attribute of the information source, or calculated using various methods (see Spatialization, below). Mass nouns1 that have quantitative values are often useful. These values are used to implement a co-ordinate system. Once the decision of choice of landscape has been made, other attributes can be chosen to function as landmarks, to be placed in the co-ordinate system. The landmarks are organized and displayed (automatically) based on relationships among them.
Information
features--properties of the landmarks--are used to modify the
display features (colour, shape, size, height) to produce different
models (i.e., maps) that expose facets of the information. Facets may
be hidden relationships or patterns in the data, in addition to known
or expected relationships.
A simple example: In the following figure, attributes of the table (on the left) provide the X and Y coordinates (location information) and display features for information landmarks in the information map (on the right). A primary key identifies the landmarks, but this is not a requirement. Another simple example, for comparison.
Fig. Extracting coordinates and attributes from data
Further details can be found in this rather long paper covering all aspects of Information Cartography. Among other things it covers spatial metaphors, methods, models, techniques and research for solving the problems of visuo-spatial structuring of information, and attempts to systematize the use of cartographic metaphors and techniques for application to non-geographic data. It includes many examples of information maps (probably the best way to appreciate the power and wide applicability of Information Cartography). Other papers on the use of spatial information systems (or specifically, GIS) for spatial analysis of non-spatial data can be found in the Reference section, below.
Spatialization
The process of developing the map, or landscape, on which your information can be displayed has been called spatialization --"spatialization maps physical space to abstract domains .. in user interfaces ..through spatial metaphors" (Skupin & Buttenfield,1997). Lakoff (1987) was the first to define spatialization as a metaphoric mapping between physical and conceptual space, and saw it as fundamental to the way humans process information.
Spatialization, then, means finding X and Y coordinates for your data, analogous to latitude and longitude, and is dependent on the type of data, or even the particular data you are wanting to map. Multi-dimensional scaling (MDS), latent semantic indexing (LSI), or statistical correlations can be used if the data is numeric. Categorical or ordinal data requires a more creative approach. If the suggestions given in the rather long paper don't suit you, look at de Jongh & Ormeling (2003), see Fabikant's page on spatialization, or search the Web for spatialization.
Maps plot X and Y coordinates to produce points (cities, trees, symbols), lines (roads, rivers) and polygons (buildings, states, countries) that represent information on the map, as landmarks. Information maps can use the same features to represent abstract information as landmarks. Colour can be added, or size/width can be modified to indicate values, or degrees of values, of attributes associated with the landmarks. In 3D maps, elevation can be used to indicate values, as is done in bar-charts or topographic maps.
This example of Information Cartography applied to change in citation rates among the top 100 information scientists uses a topographic 2map metaphor (correlations and MDS were used by the authors of the data to produce the X, Y coordinates). The information map at the top of this page summarizes the rate of change for citations, for three periods.
If this brief introduction and the referenced papers don't inspire you, Dorling and Fairbairn's(1997) book on mapping has many astounding examples of real-world maps that can, by drawing analogies, be used as a basis for designing information maps (see for example this "map" of the Linux kernel).
3D Field does not use the term "information cartography" specifically, but epitomizes the process. A brilliant piece of software for doing information cartography without a full-blown GIS system.
KartOO Technologies
[defunct] KartOO was similar to Google, but displayed results as a topological surface and graph. KartOO underwent a transition from being a provider of services based on the their search and information cartography technology, to being mainly a software publisher specializing in "cartographic visualization."
Text-based content analysis software--"a collection of Natural Language Processing (NLP), Market Research and Survey analysis tools." Not classical information cartography, but "Massive data analysis and information cartography (text mining)" is one of the Information RetrievalZoom product (Semantic Search Engine) also offers to "chart textual databases or knowledge bases, corresponding to a technological or competing environment, human resources of a company, etc.." capabilities described on Acetic's Software Characteristics page. Their
ViewCraft
[defunct] "specialized in Information CartographySM" Their product was a graph where the connections between nodes represented "flows of communication, regulations, money and/or resources" while the nodes represented the entities involved in the system, and to which information such as maps and documents were attached. The "info-cartographer" could then explore for "opportunities, information gaps, bottlenecks and areas to target for problem solving." For example, for "mapping the complex terrain of conflict and developing sustainable paths to resolution" (Papadopoulos, 2004).
[Now Social Research -- Mostly French] "designs and integrates information cartography tools and technologies based on the analysis of structured information." They produced a meta-search engine, similar to KartOO, WebBrain, and AnaCubis, which was a graph-based visualization of Web relationships that MapStan calls a Web Positioning SystemTM..
Other
Microsoft is planning to use IC to visualise the MSDN document set and Microsoft.NET APIs. "There is also now untold potential to achieve online IC now that there is the ability to "override tiles" in Microsoft Virtual Earth, allowing any type of information visualization to occur" (MSDN Blog, 2006,Information Cartography)
Börner, K. Multiple papers available at http://ella.slis.indiana.edu/~katy/research/index.html
Börner, K., Chen, C., and Boyack, K. (2003) Visualizing Knowledge Domains. In Blaise Cronin (Ed.), Annual Review of Information Science & Technology, Volume 37, Medford, NJ: Information Today, Inc./American Society for Information Science and Technology, chapter 5, pp. 179-255.
Dorling, D., and Fairbairn, D., (1997). Mapping: Ways of Representing the World. New York, Prentice Hall.
Fabrikant, S.I. and Buttenfield, B.P. (2001) Formalizing semantic spaces for information access. Annals of the Association of American Geographers, 91: pp 263-280.Oxford: Blackwell
[Dutch Language] Jongh, C. de (2002). Spatialiseren: niet-ruimtelijke informatie inkaart gebracht. Available at http://cartography.geog.uu.nl/students/dejongh/Inhoudsopgave.htm
Jongh, C. de, Ormeling, F. (2003). Mapping Non-Spatial Phenomena. Proceedings of the Seminars on Developing the ICA-CET Internet Cartography Course. Beijing, August 9, 2001 and Helsinki, May 28, 2002. http://lazarus.elte.hu/cet/publications/proc13-ormeling.htm
Lakoff, G. (1987). Women, Fire,
and Dangerous Things: What Categories Reveal about the
Mind. Chicago: University of Chicago Press.
McGregor, I., Crerar, A., Benyon, D. and Macaulay, C. (2002). Soundfields and Soundscapes Reifying Auditory Communities. In Ryohei Nakatsu and Hideki Kawahara (Eds), International Conference on Auditory Display (ICAD 2002), pp 290 - 294.
Microsoft (2006). Information Cartography. MSDN blogs. November 30, 2006 http://blogs.msdn.com/visual_collections/default.aspx
Old, L. John, (1999).Spatial Representation of Semantic Information. Tenth Mid-West Artificial Intelligence and Cognitive Science Society Conference (MAICS'99),Bloomington, IN, Apr.1999.
Old, L. John, (2000). Using Spatial Analysis for Non-spatial Data. Proceedings, ESRI International Users' Conference, San Diego, CA, July 2000. Technical Paper in the Modeling stream. [PDF] Available http://gis.esri.com/library/userconf/proc00/professional/papers/PAP196/p196.htm
Old, L. J., (2001). Utilizing Spatial Information Systems for Non-Spatial-Data Analysis. Scientometrics, Vol. 51, No. 3, 563–571. [PDF]
Old, L. John, (2001). Web Access to Non-spatial Data using Internet Map Servers. Proceedings, ESRI International Users' Conference, San Diego, CA, July 2001. [PDF] Available http://gis.esri.com/library/userconf/proc01/professional/papers/pap237/p237.htm.
Old, L. John, (2002). Information Cartography: Using Your GIS for Non-spatial Data Analysis. Proceedings, GIS 2002 Conference, Indianapolis, IN, Feb. 2002.
Old, L. John, (2002). Information Cartography Applied to the Semantics of Roget’s Thesaurus. Proceedings, 13h Midwest Artificial Intelligence and Cognitive Science Conference (MAICS'02), Chicago, Illinois, April 2002.[PDF]
Old, L. John, (2002). Information Cartography: Using GIS for visualizing non-spatial data. Proceedings, ESRI International Users' Conference, San Diego, CA, July 2002. [PDF] Available http://gis.esri.com/library/userconf/proc02/pap0239/p0239.htm.
Old, L. John, (2002). Information Cartography. PhD Qualifying Exam. Defense Presentation [PDF3.2MB]. Paper [MSWord with links to graphics 278 KB]
Papadopoulos, N. (2004). Mapping the Terrain of Conflict :Information Cartography Practices for Conflict Resolution. Mediate.com. Available at http://www.mediate.com/consensus/[accessed 14-APR-05]
Priss, Uta, and Old, L. John (1998). Information Access through Conceptual Structures and GIS. Proceedings, American Society for Information Science Conference (ASIS'98): Information Access in the Global Economy. Pittsburgh, Pennsylvania, Oct. 1998. [PS][PDF]
Skupin, A. Multiple papers starting in 1996. Available at http://geography.sdsu.edu/People/Pages/skupin/CVText.htm#Publications
Skupin, A.(2001). Cartographic Considerations for Map-like Interfaces to Digital Libraries. Proceedings of the Visual Interfaces to Digital Libraries Joint Conference on Digital Libraries Workshop.
Skupin, A., and Buttenfield, B.P. (1997) Spatial Metaphors for Visualizing Information Spaces. Proceedings AUTO-CARTO 13. Bethesda: ACSM/ASPRS.116-125.
Skupin, A., and Buttenfield, B.P. (1996) Spatial Metaphors for Visualizing Very Large Data Archives. Proceedings GIS/LIS’96. Bethesda: American Society for Photogrammetry and Remote Sensing. 607-617.
Skupin, A., and Fabrikant, S. (2003) Spatialization Methods: A Cartographic Research Agenda for Non-Geographic Information Visualization. Cartography and Geographic Information Science. 30 (2) 99-119.
Last updated 08/01/06